Barack Obama's Presidential Years with Figures
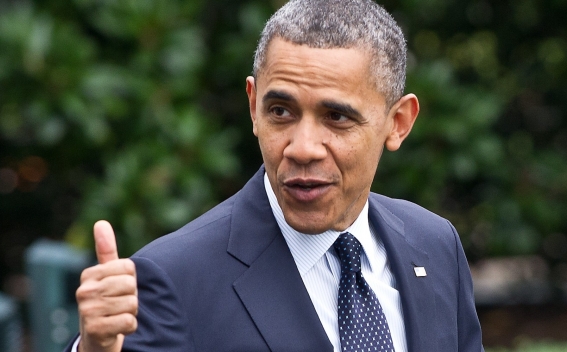
The 44th US President Barack Obama assumed his presidency on January 20, 2009 . In November 2016 presidential elections were held in the United States, which, in fact, ended the period of the Obama administration. What were the years of the Obama administration like for the US economy, let’s try to figure out with the statistics of key indicators.
Gross domestic product: US GDP per capita registered a growth trend during the Obama presidency. Thus, in 2009 the index amounted to 47 575.6 million dollars. In 2010, the index reached the threshold of $ 4834.1, in 2011- 49.725, in 2012- 51.384, in 2013- 52.608, in 2014 - 54.375, and in 2015 the GDP reached to $ 55.868.
For comparison, it should be noted that in the period of 2006-2008, the GDP per capita fluctuated between 49.000 dollars. Since 2009 (that year there was registered a decrease to 47,000) a growth was recorded.
Gross domestic product in the period of 2009-2016 showed the following statistics:
2009 - 14418.74 billion dollars,
2010 - 14964.37 billion dollars,
2011- 15517.93 billion dollars,
2012- 16.155.26 billion dollars,
2013 - 16691.52 billion dollars,
2014 - 17393.1 billion dollars,
2015 - 18036.65 billion dollars [1]
Economic growth
Unlike Gross Domestic Product data, the indicators of economic growth calculated with GDP only (calculation of factors such as inflation) did not have a stable growth trend. It should be noted that in 2009 the economic growth rate in the United States registered a record low 4.1 percent growth for the period of 1948-2016 [2]. Since 2009 the index was positive (1.6% in 2011, 2.2% in 2012, 1.5% in 2013, 2.4% in 2014, 2.4% in 2015).
Trade
In contrast to 2008, the exports from the United States showed a sharp decline in 2009. (In 2008 the threshold was 160000 million while in 2009 it was approximately 120000 million [3]), and then, the export began to increase (2011-2016 respectively: 6.9%, 3.4%, 2.8%, 3.4%, 1.1%).
In 2009, the import also registered a decline (from 240000 reaching to 120000), and then a rate of non-proportional growth was recorded (2011: 5.5% 2012: 2.2%, 2013: 1.1%, 2014: 3.8%, 2015: 4.9 %).
State debt
US government debt under the Obama administration registered a significant growth.
|
Year |
Amount, US dollar |
|
2008 |
10,024,724,896,912.49 |
|
2009 |
11,909,829,003,511.75 |
|
2010 |
13,561,623,030,891.79 |
|
2011 |
14,790,340,328,557.15 |
|
2012 |
16,066,241,407,385.89 |
|
2013 |
16,738,183,526,697.32 |
|
2014 |
17,824,071,380,733.82 |
|
2015 |
18,150,617,666,484.33 |
It is noteworthy that during Obama administration along with the state debt the public debt also grew (98.3% in 2011, 102% in 2012, 104% in 2013, 105% in 2014, 106% in 2015).
Unemployment rate
From 2008-2009 the unemployment rate in the United States ranged from 4.5-5%. From 2009-2010 it registered the highest rate, 10% in the last ten years. Since 2011, the index gradually declined (8.9% in 2011, 8.1% in 2012, 7.4% in 2013, 6.2% in 2014, 5.3% in 2015)
Positive trends were demonstrated in inflation - reaching -0.9% in 2015 from the 3.9% of 2009.
The average wage per hour has also increased. From $ 18 / per hour figure of 2008 it reached to $ 22 / per hour in 2016. [5]
Most statistics also showed decline in military expenditures. From 2008-2009 US military spending was around 621131 million. Only in 2010, the military budget grew reaching 698180 million dollars, after which there was a decline (in 2012 - 684780 million, in 2013 - 640221 million), reaching $ 598.5 billion in 2015.
[1] http://www.tradingeconomics.com/united-states/gdp-per-capita, http://www.tradingeconomics.com/united-states/gdp
[2] http://www.tradingeconomics.com/united-states/gdp-growth-annual
[3] http://www.tradingeconomics.com/united-states/exports
[4] https://www.treasurydirect.gov/govt/reports/pd/histdebt/histdebt_histo5.htm
[5] http://www.tradingeconomics.com/united-states/wages
Other materials on this subject
- Around 25 Domestic Terrorism Cases Opened in US after Congress Storming About 25 cases of domestic terrorism were opened in the US following the unrest caused by supporters of US President Donald Trump in the Capitol building.
- Former New York City Mayor Mike Bloomberg Eyeing Presidential Bid He has not decided whether to run for president but is back to actively considering it and is taking this step to keep his options open.
- Putin: Trump Opponents Harm US with 'Invented' Russia Scandal Putin said the US opposition was not treating those who elected Mr. Trump with respect.
- Is Trump’s Replacement Realistic? However, how are the congressmen going to prove that Donald Trump is "incapacitated"?
- Will Putin-Trump Romance End Soon? ...to fully understand the logic of Trump’s policy towards Russia, it is helpful to get acquainted with the logic of deal-making introduced by Trump in his book entitled "The Art of the Deal'.

Read also
-

Phone conversation of the Foreign Minister of Armenia with the U.S. Assistant Secretary of State for European and Eurasian...
-
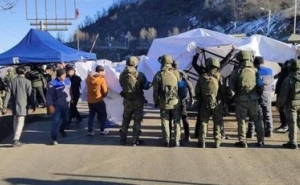
France, US urge 'immediate' end to Nagorno Karabakh blockade
-
The United States withdrew from sanctions against Syria for six months the provision of assistance after the earthquake
-
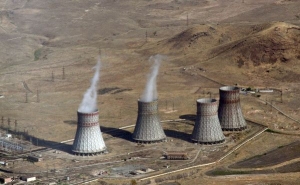
Armenia to sign new agreement with US in nuclear energy use
-

White House denies US Navy's involvement in blowing up Nord Stream 2
-
Armenia's Makunts meets with new U.S. senior advisor for Caucasus negotiations
-
Moscow, Tehran Advance Plans for Iranian-Designed Drone Facility in Russia. WSJ
-
US Department of State confirms decision to postpone Blinken’s visit to China
-
 17:08
17:08The regular session of the Anti-corruption Policy Council takes place in Jermuk
-
 15:05
15:05The Prime Minister sends congratulatory messages to the supreme leader of Iran and the President of Iran
-
 11:11
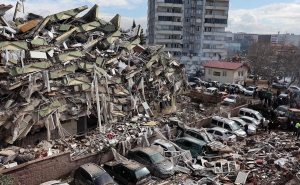
11:11Armenia sends earthquake aid to Turkey
-
 10:43
10:43Commemoration of the Pontiff St. Sahak Partev
-
 09:16
09:16Some roads are closed and difficult to pass in Armenia
-
 19:55
19:55Phone conversation of the Foreign Minister of Armenia with the U.S. Assistant Secretary of State for European and Eurasian Affairs
-
 18:30
18:30Prime Minister Pashinyan and President Khachaturyan meet
-
 18:20
18:20Ararat Mirzoyan with Co-Chairman of the OSCE Minsk Group of France Brice Roquefeuil
-
 17:01
17:01Humans could land on Mars within 10 years, Musk predicts
-
 16:45
16:45France, US urge 'immediate' end to Nagorno Karabakh blockade
-
 16:01
16:01Blockaded Nagorno Karabakh launches fundraiser to support quake-hit Syria
-
 15:59
15:59Earthquake death toll in Turkey rises to 18,342
-
 15:43
15:43Ararat Mirzoyan Held a Telephone Conversation with Sergey Lavrov
-
 15:06
15:06French president rules out fighter jet supplies to Ukraine in near future
-
 14:47
14:475 Day Weather Forecast in Armenia
-
 14:44
14:44President Vahagn Khachaturyan wrote a note in the book of condolences opened in the Embassy of Syria in Armenia
-
 14:20
14:20Azerbaijan’s provocations impede establishment of peace and stability – Armenian FM tells Russian Co-Chair of OSCE MG
-
 12:57
12:57France representation to OSCE: Paris calls on Azerbaijan to restore freedom of movement through Lachin corridor
-
 11:40
11:40Command of Kosovo forces highly appreciated preparation of Armenian peacekeepers
-
 10:16
10:16The United States withdrew from sanctions against Syria for six months the provision of assistance after the earthquake
day
week
month
Humidity: %
Wind: km/h